Cut grid losses to decarbonise electricity distribution
 Aydem Holding
 SKD Türkiye
总结
Technical and commercial losses on a distribution network were held far below the sector average, so the electricity never had to be generated and its emissions never occurred.
Context
Submitted through the COP31 Sustainable Transformation Awards · SKD Türkiye (WBCSD Global Network Partner)
The company operates two electricity distribution businesses in the energy sector, supplying a population of more than 9 million across five provinces, and employs more than 1,000 people.
Every unit of electricity that enters a distribution network and never reaches a metered customer has still been generated. Technical losses in conductors, transformers and unbalanced phases, together with non-technical losses from unmetered or manipulated consumption, therefore carry the emissions of the generation that produced them, along with the fuel burned to produce it.
The sector average for combined technical and non-technical losses in the country is around 10%, and the regulator sets loss targets for each distribution company inside five-year tariff periods. Most operators treat this as a commercial and regulatory question about revenue recovery.
The company's position is different: it treats loss reduction as a climate measure. If the energy is never lost, it never has to be generated, and the emissions associated with that generation are prevented at source rather than compensated afterwards. This framing is what turns a routine efficiency programme into a reported emissions result.
Loss reduction work has run since the company began operations, and was structured as a defined initiative for the 2021 to 2025 period against a 2020 reference year. Results are reported in annual sustainability reports prepared to GRI standards and appear in the regulator's annual electricity market sector reports.
Location of the initiative: Five provinces in Türkiye served by the group's two electricity distribution companies
Solution
The initiative combines physical network work with a metering and analytics layer, and treats the two as one operating model rather than as separate investment lines.
On the physical side the network is corrected where the losses physically occur: transformer optimisation so that units match the load they serve, correct conductor selection for the current carried, phase balancing to remove the losses caused by uneven loading, and underground cabling in place of vulnerable overhead sections.
On the data side, automatic remote meter reading and smart meter operations make consumption observable continuously, and energy input and output balances are analysed digitally so that the difference between what enters a feeder and what is billed on it can be followed rather than reconstructed at year end.
Predictive data analytics and consumer profiling algorithms then work on that data to identify where non-technical loss is concentrated, so that inspection effort is directed by evidence instead of by routine.
The distinguishing feature is the combination: physical modernisation investments such as underground network work are supported by profiling algorithms and data processing technologies, which converts a set of separate measures into an end-to-end smart grid and energy efficiency model.
The same transformation raises the flexibility of the network, which provides the infrastructure for renewable generation to be integrated safely and therefore supports the wider energy transition rather than only reducing losses.
The emissions result is calculated with the approach of energy that no longer needs to be generated, applied in line with the GHG Protocol standards, so that a kilowatt hour saved on the network is reported as avoided generation emissions.
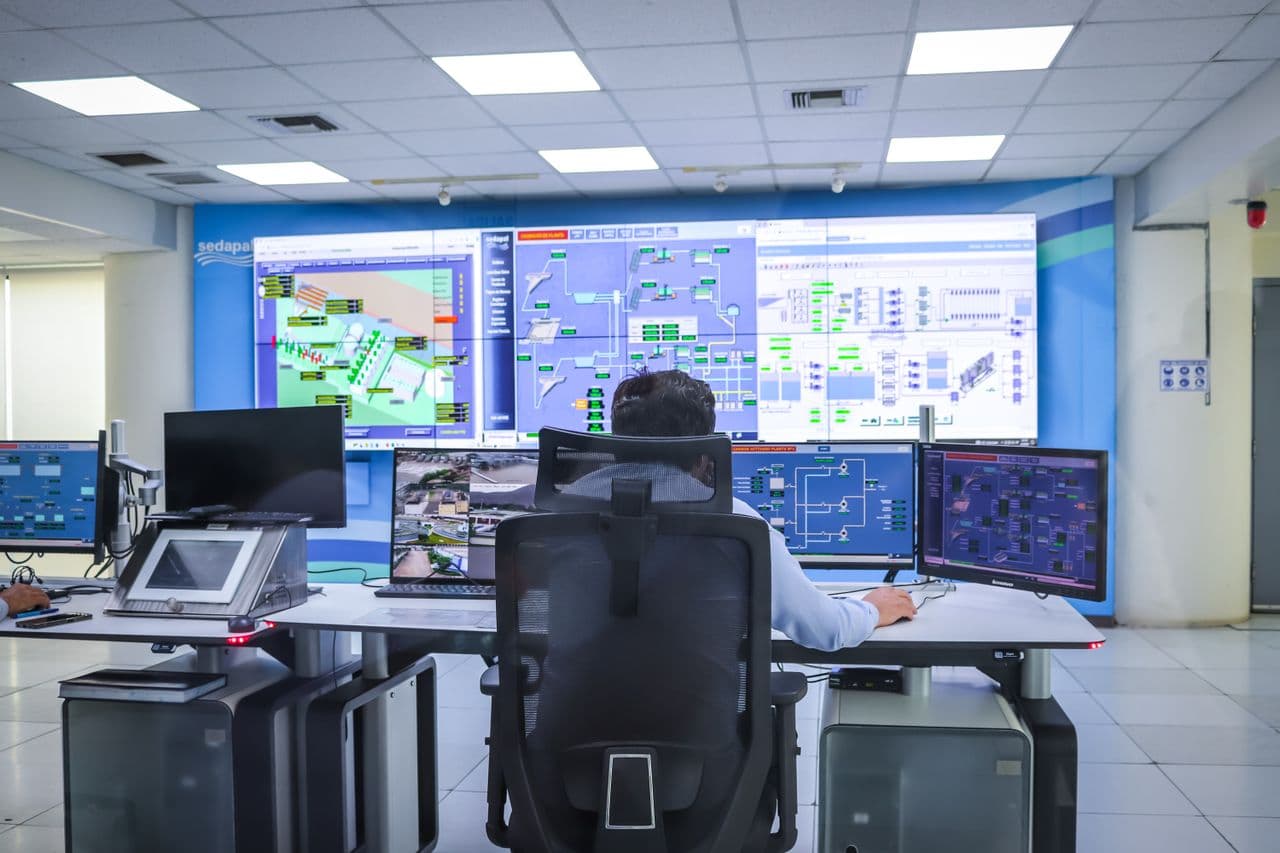
Figure 1: The Adm Elektrik distribution control centre, where network performance and losses are monitored across the service area.

Impact
Sustainability impact
Climate
The initiative targets Scope 2 emissions: the emissions of the electricity that has to be generated to cover losses on the distribution network. It does not act on the company's own fuel or vehicle use, but on the volume of generation the network requires in order to deliver the same billed consumption.
The reference year is 2020, when the average loss rate on the network was 6.34%. Over the five-year application period from 2021 to 2025 the rate was held at an average of 5.77%, below the regulator's targets and well under the national sector average of around 10%. The stability of that figure across five consecutive years, rather than a single good year, is what demonstrates operational control.
The efficiency gain produced a total saving of 850,854,467 kWh over the monitoring period, in other words more than 850 million kWh of electricity that did not have to be generated.
Calculated with the energy that no longer needs to be generated methodology and in line with the GHG Protocol standards, that saving prevented 371,803 tonnes of carbon dioxide equivalent of Scope 2 emissions from reaching the atmosphere. The saved electricity is equivalent to the annual consumption of approximately 170,000 households.
Measurement and monitoring rely on real-time tracking of remote meter reading data from the field and on digital analysis of energy input and output balances. The three indicators followed are the network loss rate as a percentage, the energy saved in kWh and the Scope 2 emissions prevented in tCO2e.
The figures are published in annual sustainability reports prepared to GRI standards and in the regulator's annual electricity market sector reports, so they are open to external scrutiny.
Nature
Lower losses mean less generation, and less generation means lower fossil fuel consumption at the power stations that would otherwise have covered the shortfall, which reduces the extraction and combustion of fuel upstream of the distribution business.
The same modernisation raises network flexibility, which is the physical precondition for integrating renewable generation at scale, so the environmental benefit continues after the loss reduction itself has reached its practical limit.
Social
Security of supply is the direct social outcome. More than 9 million people across five provinces receive uninterrupted supply from a network that is observed continuously rather than inspected periodically, and industrial customers gain the supply reliability their production depends on.
The company links the initiative to four United Nations Sustainable Development Goals, covering affordable and clean energy, industry and infrastructure, responsible consumption and climate action.
Community engagement runs in both directions. Reporting and request channels through short messaging, e-mail, call centres and digital services are open to residents, while field staff feed improvement ideas into the process through internal platforms. Communication campaigns and consumer awareness work accompany interventions on unmetered use, which is how local resistance to enforcement is addressed.
The avoided energy also has a national value: electricity that does not have to be generated reduces the cost borne by the wider economy.
Business impact
Benefits
The commercial benefit is the value of the electricity retained on the network. A saving of 850,854,467 kWh over the period is energy that the business no longer has to procure to cover losses, and holding the loss rate below the regulator's targets protects the revenue that would otherwise be forfeited under the tariff mechanism.
Because the loss rate was kept at an average of 5.77% against a reference of 6.34% across five consecutive years, the gain is structural rather than a one-off correction, which makes it bankable in investment planning.
Continuous observation of the network through remote meter reading also improves supply continuity for customers and reduces the commercial disputes and manual reconciliation associated with unmetered consumption.
The model itself has value beyond the two distribution companies: it is designed to be transferable to the other 19 electricity distribution companies in the country and to network operators abroad through technology transfer partnerships.
Costs
The cost base is infrastructure investment: transformer and conductor work, phase balancing, underground cabling, smart meter deployment and remote meter reading systems, together with the data processing, analytics and profiling capability that sits on top of them.
Investment costs are the main risk to wide deployment, and the return depends on the loss rate an operator starts from. A network already close to the technical minimum will not repay the same spend, so the case is strongest where the starting loss rate is high.
Funding is secured through guaranteed investment budgets inside the regulator's five-year tariff periods combined with the company's own resources, which is what allows a five-year programme to be committed rather than funded year by year.
There is a social cost as well as a financial one. Interventions against unmetered consumption can meet local resistance, which has to be managed through communication campaigns and consumer awareness work rather than enforcement alone.
Operating costs shift rather than disappear: field inspection effort falls, while data infrastructure, analytics and the skills to run them become permanent line items.
Impact beyond sustainability and business
Co-benefits
The efficiency gain in distribution removes the need for additional generation at power plants, which lowers fossil fuel consumption and accelerates decarbonisation across the energy sector rather than inside one company.
The same work builds systemic resilience: consumers and industrial facilities gain security of supply, which protects continuous production and welfare in the service area.
Because the model rests on a financing structure that combines the operator's own resources with regulated investment budgets, it can be replicated by the other 19 distribution companies in the country under the same policy framework, and extended abroad through technology transfer partnerships.
Potential side-effects
Concentrating loss management on data raises dependence on metering infrastructure, communication links and analytics capability. The benefits only appear once metering coverage is sufficient, so partial deployment produces partial results.
Enforcement against unmetered consumption can generate local social resistance, which is why communication and awareness work is treated as part of the initiative rather than as public relations after the fact.
Loss reduction also has a floor. Technical losses cannot be eliminated, so an operator approaching the physical minimum should expect the marginal cost of each further tenth of a percentage point to rise, and should plan the next stage of savings — satellite based meter reading and analytics supported detection of unmetered use — before the current curve flattens.
Implementation
Typical business profile
The model suits licensed electricity distribution companies and other network operators that carry losses between the point of supply and the point of billing, particularly where the starting loss rate is above the technical minimum and where a regulator sets loss targets inside multi-year tariff periods.
It is most relevant for operators that already have a metering estate they can extend, a control and data function able to run analytics, and a regulated investment budget that can carry a five-year commitment.
Delivery engages measurement and loss control, regional operations, research and development, market operations, system operation and planning functions working to a shared reporting cycle.
Approach
Fix the loss baseline and the accounting method: Measure the technical and non-technical loss rate for the whole network in a defined reference year, agree how saved energy will be converted into emissions, and publish the method before any investment is committed.
Separate technical from non-technical losses: Use energy input and output balances at feeder and transformer level to split physical losses from unmetered or manipulated consumption, because the two categories need different remedies and different budgets.
Correct the physical network where the losses occur: Optimise transformer sizing and siting, select conductors correctly for the load carried, balance phases across the network, and replace vulnerable overhead sections with underground cabling.
Instrument the network for continuous data: Extend automatic remote meter reading and smart meter operations so that consumption and losses are observed in real time rather than reconstructed from periodic readings.
Profile consumption to locate non-technical losses: Apply consumer profiling algorithms and predictive analytics to the metering data so that inspection effort is directed at the largest deviations instead of distributed evenly.
Convert saved energy into a reported emissions figure: Apply the energy that no longer needs to be generated approach in line with the GHG Protocol standards, so that kilowatt hours retained on the network are reported as avoided Scope 2 emissions and can be audited.
Secure multi-year funding: Align the investment plan with the regulated five-year tariff periods so the budget is guaranteed across the whole programme, and complement it with the operator's own resources.
Manage the social side of enforcement and keep improving: Run communication campaigns and consumer awareness work alongside interventions on unmetered use, keep reporting channels open through short messaging, e-mail, call centres and digital services, take improvement proposals from field staff through internal platforms, and publish results in annual sustainability reports.
Stakeholders involved
Project leads: Senior management and the boards of the two distribution companies own the initiative directly as part of the corporate vision, which places loss reduction in the strategic agenda rather than in routine maintenance. Day-to-day delivery in the field is followed by the measurement systems and energy losses control directorate together with the regional directorates, so the accountability for the loss rate sits with a named function rather than being shared out.
Company functions: The research and development centre, market operations, system operation and planning directorates contribute supporting work to the improvement effort, each addressing a different part of the loss chain. Field personnel are treated as a source of improvement rather than only as executors: they feed their own ideas for improvement into the process through internal platforms, and those proposals are taken up in the continuous improvement cycle. Results are consolidated into annual sustainability reporting prepared to GRI standards through the corporate integration structure, which keeps operational data and disclosure on the same figures.
Main providers: Technology suppliers work with the company on the design of the modernisation programme, with project design shaped in coordination with them against the identified modernisation needs rather than specified in isolation and tendered afterwards. The supplier relationship covers metering, communication and analytics capability as well as the physical network equipment.
Other: The energy market regulator sits at the centre of the decision-making process: it sets the regulatory framework and the boundaries of investment, and its five-year tariff periods carry the guaranteed investment budgets that fund the work. Local communities are engaged as an external stakeholder through active reporting and request systems using short messaging, e-mail, call centres and digital channels, which gives residents a route into the process and gives the company field intelligence on unmetered use. The other 19 electricity distribution companies in the country are potential adopters, and the model is offered to them and to network operators abroad through technology transfer partnerships.
Key parameters to consider
The programme runs on a five-year cycle aligned with the regulator's tariff periods, which is also the horizon over which the investment budget is guaranteed; this alignment is a precondition for the model rather than a convenience.
The reference year is 2020 and the reported result covers 2021 to 2025, so the figures represent a sustained average rather than a peak.
The emissions figure depends on the conversion method: the saving is reported as avoided generation under the energy that no longer needs to be generated approach, which means it should not be added to reductions reported by generators for the same electricity.
The next stage of the roadmap is wider deployment of satellite based meter reading and analytics supported detection of unmetered use, which is where the remaining savings are expected to come from.
Implementation and operations tips
Frame loss reduction as generation avoided, not only as revenue protected. The same operational work produces a reportable emissions result once the conversion method is agreed and documented in advance.
Hold the average rather than chase a record. A rate kept at 5.77% across five consecutive years is more credible evidence of operational control than a single low year, and it is what makes the saving defensible in external reporting.
Pair the physical and the digital work. Underground cabling and transformer optimisation without metering data cannot be verified, and analytics without physical correction cannot fix technical losses.
Plan the social response before enforcement begins. Interventions on unmetered consumption are where programmes stall, and communication campaigns and awareness work cost far less than the delay they prevent.
Use the regulated investment cycle. Aligning the programme with tariff periods converts a discretionary efficiency project into a funded multi-year commitment.