Make logistics carbon visible shipment by shipment
 Korozo Ambalaj
 SKD Türkiye
总结
Each domestic shipment is given its own carbon figure, so freight decisions can be ranked by emission intensity instead of by cost and delivery time alone.
Context
Submitted through the COP31 Sustainable Transformation Awards · SKD Türkiye (WBCSD Global Network Partner)
The company manufactures flexible packaging in Türkiye and employs more than 1,000 people, moving finished goods to customers through an extensive domestic road logistics operation.
Logistics emissions were the part of the footprint that management could not see in detail. Before the initiative, logistics emissions were available primarily at an aggregated level, limiting visibility at individual shipment level.
That gap had a practical consequence. Freight decisions traditionally focused primarily on cost and delivery time, while shipment-level carbon information was not yet available as a routine decision parameter.
The company therefore set out to calculate emissions at the level at which logistics decisions are actually made — the individual shipment — and to build that calculation into routine management reporting rather than into an annual reporting exercise.
The initiative began in 2024, now covers all domestic logistics operations and has been established as a standing part of the company's climate management rather than a one-off analysis.
Location of the initiative: Türkiye — domestic logistics operations
Solution
The initiative replaces an aggregate view of logistics emissions with a shipment-level calculation, applied across the whole domestic operation.
The calculation is built on the GHG Protocol Scope 3 standard and integrates the variables that determine the carbon outcome of a consignment: transport mode, vehicle type, transport distance, shipment weight, tonne-kilometre data and vehicle load factor. Combining them produces a carbon figure for each individual shipment rather than a single annual total.
That shift is what changes the management value of the data. Where emissions were previously visible only as a company-level number, each shipment can now be calculated, compared against others and tracked over time, so high-intensity routes, transport patterns and operations can be identified by name instead of being suspected.
The output is decision support rather than a report. Conventional logistics management optimises cost and service; the same data set now also ranks options by carbon intensity, which allows load consolidation, higher vehicle load factors, full truckload transport and route optimisation to be assessed on both dimensions at once.
The method is deliberately generic. Because it rests on shipment attributes rather than on a particular fleet or contract, it can be adapted to road, sea and air transport, and to other sectors with heavy logistics activity such as manufacturing, fast-moving consumer goods, automotive and chemicals. It can be integrated into enterprise resource planning and logistics management systems, which is how the calculation moves from analysis into routine operation.
Figure 1: Consolidating partial shipments into full truckloads, the change that shipment-level carbon data made visible.

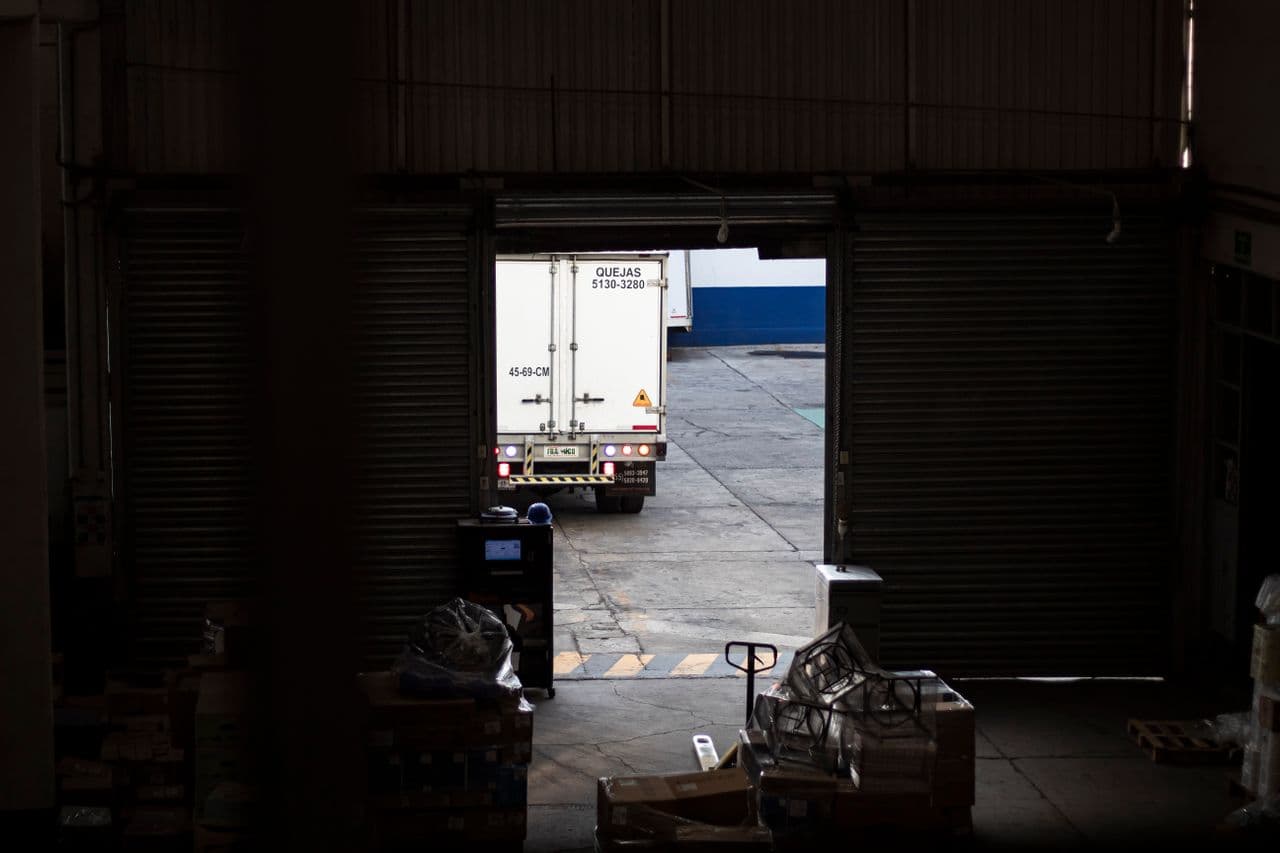
Figure 2: Warehouse and dispatch operations, where the shipment-level data is captured.

Impact
Sustainability Impact
Climate
The initiative addresses Scope 3 greenhouse gas emissions arising from the company's domestic logistics activity, calculated in line with the GHG Protocol Scope 3 standard on a shipment-by-shipment basis.
The year 2024 was set as the base year, and all domestic logistics operations for 2024 and 2025 were analysed. Across 6,576 shipments in 2024 and 5,547 in 2025, covering 38.4 million kg of freight movement, approximately 1,875,892 kg CO2e of logistics-related emissions were calculated.
The result of the work to date is measurement and visibility rather than a reduction: emission-intensive routes, transport patterns and operations have been identified with supporting data, and load consolidation, higher vehicle load factors, full truckload transport and route optimisation have been established as the reduction opportunities to be pursued. Those remain targets rather than achieved reductions.
Performance is tracked through five indicators: CO2e per shipment, emission intensity per tonne-kilometre, the ratio of full truckload to less-than-truckload transport, vehicle load factor and route-level emission intensity. Emission data is analysed monthly, integrated into internal management reports and followed within the sustainability performance management system.
The applicable GHG Protocol Scope 3 category is Category 4 – Upstream Transportation and Distribution, covering third-party transportation and distribution services purchased by the company.
Nature
Potential future improvements in load consolidation, vehicle load factors and route optimisation may reduce the number of vehicle movements required for the same freight volume, with potential associated benefits for road traffic, local air emissions and noise.
The emission inventory also creates the baseline against which any future modal or routing change can be assessed, so environmental trade-offs between transport options can be examined with data rather than assumed.
Social
Carbon transparency has been extended into supplier relationships. Logistics partners take part in providing shipment data and in identifying improvement areas in transport processes, which gives them visibility of their own emission performance rather than only of their service and cost performance.
The approach encourages behavioural change among logistics partners around load factors, route optimisation and emission performance, and carbon performance is being brought into supplier evaluation criteria alongside conventional measures.
Internally, monthly emission performance reports and sustainability dashboards give operational teams a routine feedback channel, so logistics staff can see the consequence of their own routing and loading decisions.
Business Impact
Benefits
The same variables that drive emissions drive logistics cost. Load factor, empty running, consolidation opportunities and route efficiency became measurable at shipment level, which supports operational efficiency decisions and carbon decisions from one data set rather than two.
The work produced a baseline emission inventory based on shipment-level data. Future reduction projects can be measured against 2024 rather than argued about, which is a precondition for both target setting and credible reporting of progress.
Carbon data has entered supplier management. Transport partners can be assessed on emission performance as well as price and service, which provides an additional performance dimension for supplier discussions and customer conversations about supply chain sustainability.
Customers increasingly request evidence of sustainable supply chain management, and shipment-level data allows those requests to be answered specifically rather than with an aggregate corporate figure. The results can support the company's broader climate reporting and disclosure activities.
Costs
The main cost is data. Shipment-level calculation requires transport mode, vehicle type, distance, weight, tonne-kilometre and load factor data for every consignment, which has to be collected, cleaned and reconciled — including data that originates with logistics service providers rather than inside the company.
Methodology development and data validation absorbed effort from sustainability, logistics, supply chain, finance and data analytics functions, and the monthly analysis and reporting cycle is a continuing operational commitment rather than a one-off project cost.
The results depend on the quality of partner data, so the model carries a dependency on logistics service providers being willing and able to share consignment-level information consistently.
Costs are contained by building on existing digital infrastructure and data management systems, by integrating the calculation into enterprise resource planning and logistics management systems rather than maintaining it separately, and by embedding the indicators in the corporate indicator set so that reporting is not duplicated.
Project-specific investment in the measurement system has not been separately quantified. However, the logistics optimisation measures implemented alongside the initiative have delivered measurable operational benefits. Transport expenditure decreased from approximately €1.4 million to approximately €0.7 million, while the share of partial shipments was reduced from around 70% to approximately 5–10%. FTL multi-stop shipment models were also introduced to improve load consolidation and transport efficiency.
Impact Beyond Sustainability And Business
Co-benefits
Making carbon visible at consignment level changes how logistics decisions are framed. Carbon becomes a parameter considered alongside cost and time in supply chain decisions, which encourages higher vehicle load factors, less empty running, load consolidation and route optimisation as normal operating behaviour rather than as special initiatives.
The methodology is transferable. It can be adapted to road, sea and air transport and applied in other logistics-intensive sectors, and it is integrable with enterprise resource planning and logistics management systems, so other companies can adopt the structure without building it from the beginning.
Because the calculation runs on operational data already generated by the business, the same infrastructure serves operational management, sustainability reporting and climate disclosure at once.
Potential side-effects
Shipment-level accuracy depends on the completeness of partner data. Where load factor or vehicle type information is estimated rather than recorded, the calculation inherits that uncertainty, and comparisons between routes become weaker than they appear.
Measurement is not reduction. The inventory identifies where emissions are concentrated but does not by itself remove them, and consolidation or full truckload conversion can conflict with delivery lead times and customer service commitments, so the trade-off has to be managed rather than assumed away.
A logistics carbon model also transfers effort to suppliers, who have to report data they may not previously have collected. Sustaining that requires the reporting requirement to be built into supplier evaluation and dialogue rather than requested informally.
Implementation
Typical Business Profile
The model suits manufacturers with substantial outbound freight volumes and a dispersed customer base, where transport is contracted to service providers and the emissions therefore sit outside the company's own fleet.
It applies to logistics-intensive sectors including manufacturing, fast-moving consumer goods, automotive and chemicals, and to companies that already hold shipment records in enterprise resource planning or transport management systems, since the calculation is built on data the business already generates.
Delivery requires sustainability, logistics, supply chain, finance and data analytics functions to work to a common data definition, and senior management sponsorship to keep carbon indicators inside the corporate indicator set rather than in a parallel sustainability report.
Approach
Define the boundary and the decision unit: cover all domestic logistics operations and calculate at the level of the individual shipment, because that is the level at which mode, vehicle and routing choices are actually made.
Set the base year: fix 2024 as the baseline against which subsequent performance is measured, so that later changes can be attributed rather than merely observed.
Specify the data set per shipment: collect transport mode, vehicle type, transport distance, shipment weight, tonne-kilometre data and vehicle load factor, and identify which fields come from internal systems and which have to be obtained from logistics service providers.
Build the calculation on a recognised standard: develop the emission calculation in line with the GHG Protocol Scope 3 standard so that the results are comparable, and can support consistent internal and external reporting.
Recalculate the historical operation: apply the method to completed shipments — 6,576 in 2024 and 5,547 in 2025, covering 38.4 million kg of freight — to produce a baseline inventory instead of starting the record from the go-live date.
Rank operations by emission intensity: use the results to identify high-intensity routes, transport patterns and operations, and convert them into a prioritised list of consolidation, load factor, full truckload and route optimisation opportunities supported by data.
Embed five indicators in management reporting: track CO2e per shipment, emission intensity per tonne-kilometre, the full truckload to less-than-truckload ratio, vehicle load factor and route-level emission intensity; analyse them monthly and integrate them into internal management reports and the sustainability performance management system.
Extend carbon transparency to logistics partners: share performance data with transport providers, run supplier evaluation discussions on emission performance alongside cost and service, and bring carbon into supplier assessment criteria so that improvement is driven through the contracted fleet rather than only through internal planning.
Stakeholders Involved
Project leads: The initiative is owned by senior management and positioned as a component of the corporate sustainability strategy. It is led by the Chief Innovation and Sustainability Officer, and senior management reviews and steers it against the company's sustainability targets on a regular cycle. Strategic direction from senior management is what keeps the work aligned with corporate climate objectives, and results are reported upwards periodically rather than only at year end.
Company functions: Governance rests on coordination between the sustainability team and the logistics, supply chain, finance and data analytics functions. Development of the calculation methodology, data validation and performance monitoring are shared responsibilities rather than the property of one team. Logistics, supply chain and sustainability teams jointly defined the emission calculation methodology, the data scope and the indicator set at design stage, which is why the indicators are operationally usable rather than reporting artefacts. Continuity is secured through the existing digital infrastructure, data management systems and integration into the corporate indicator set.
Main providers: Logistics service providers supply shipment data and take part in identifying improvement areas in transport processes. The relationship is managed as a data-sharing and performance dialogue, with supplier evaluation discussions covering emission performance alongside service and cost. Developing data sharing with transport providers, and integrating carbon performance into supplier assessment criteria, is treated as the principal lever for extending the model beyond the company's own planning decisions.
Other: Customer expectations for sustainable supply chain management form an external input that shaped the direction of the work, and internal operations teams provide the routine feedback that keeps the method usable in day-to-day planning. Feedback runs through monthly emission performance reports, supplier evaluation meetings and internal sustainability dashboards, so operational teams and logistics partners contribute to continuous improvement rather than receiving results after the fact. Emission data can also support the company's broader climate reporting and disclosure activities.
Key Parameters To Consider
Scope is all domestic logistics operations, with 2024 as the base year and 2024 and 2025 analysed in full. The calculation follows the GHG Protocol Scope 3 standard and operates at shipment level.
The method is mode-independent and can be adapted to road, sea and air transport, which makes the constraint data availability rather than transport type.
Integration with enterprise resource planning and logistics management systems is what turns the calculation from an analysis into an operating system, and integration with the corporate indicator set is what keeps it running after the project phase.
Monitoring is monthly, feeding internal management reporting and the sustainability performance management system.
Implementation And Operations Tips
Calculate at the level at which decisions are made. An annual total cannot change a routing decision; a figure attached to an individual shipment can, which is the difference between reporting emissions and managing them.
Rebuild the history before going live. Applying the method retrospectively to completed shipments produces a baseline immediately, whereas starting the record at go-live postpones any comparison by a full reporting cycle.
Use indicators that operations teams already understand. Load factor and the full truckload to less-than-truckload ratio are logistics measures before they are carbon measures, which is why they change behaviour where an abstract emissions figure does not.
Secure logistics partner data early. The largest practical obstacle is consignment-level information held by transport providers, and it is easier to build the requirement into supplier evaluation than to request it case by case.
Separate visibility from reduction when reporting progress. Presenting an identified opportunity as an achieved saving undermines the credibility of the measurement system that produced it.